Infographics are widely used in various fields, such as education, business, marketing, journalism, and social media. However, creating infographics can be time-consuming, tedious, and require design skills. Is there a way to make infographics easier and faster?
Of course! You can use AI to generate infographics from text, data, or images, using natural language processing, computer vision, and machine learning techniques. In this article, we will explore what AI infographics are, how they work, and how to make them with an AI tool.
Part A. What to Know About AI Infographics?
What are infographics?
Infographics are graphical representations of data, information, or knowledge that can help people understand complex topics, communicate messages, or tell stories. Infographics can use various elements, such as charts, graphs, icons, images, maps, diagrams, timelines, and text, to present information in a clear, concise, and engaging way.
Examples of infographics:
- A chart comparing the features and prices of different smartphones
- A timeline showing the history and evolution of the internet
- A diagram explaining how a solar panel works
- ...
What are the applications of infographics?
- Education: Infographics can help students and teachers learn and teach complex topics, such as science, math, history, and geography, by visualizing concepts, facts, and processes. Infographics can also help students and teachers create presentations, reports, posters, and portfolios, by showcasing their research, findings, and arguments.
- Business: Infographics can help businesses and organizations communicate their vision, mission, values, goals, and strategies, by highlighting their strengths, achievements, and impacts. Infographics can also help businesses and organizations analyze and display their data, such as sales, revenue, growth, and customer feedback, by revealing patterns, trends, and insights.
- Marketing: Infographics can help marketers and advertisers promote their products, services, brands, and campaigns, by attracting attention, increasing awareness, and generating interest. Infographics can also help marketers and advertisers persuade and influence their target audience, by providing evidence, testimonials, and calls to action.
- Journalism: Infographics can help journalists and media outlets report and explain current events, issues, and stories, by providing context, background, and perspective. Infographics can also help journalists and media outlets inform and educate their readers, viewers, and listeners, by providing facts, statistics, and analysis.
- Social media: Infographics can help social media users and influencers share and express their opinions, ideas, and experiences, by creating and posting original, creative, and viral content. Infographics can also help social media users and influencers connect and interact with their followers, fans, and friends, by inviting comments, likes, and shares.
How does AI work to generate infographics?
The basic steps of generating infographics with AI are:
- Input: The input can be a paragraph of text describing a topic, a table of data showing some statistics, or an image of a product or a person.
- Analysis: The analysis is the process of extracting and understanding the meaning, structure, and relevance of the input.
- Design: Select and arrange the appropriate infographic elements, such as charts, graphs, icons, images, maps, diagrams, timelines, and text, to present the information in a clear, concise, and engaging way.
- Output: The output is the final infographic that is generated from the input, analysis, and design. The output can be saved, edited, shared, or printed as desired.
What are the advantages of generating infographics with AI?
- Save time and effort, as it can automate the tedious and repetitive tasks of creating infographics, such as data collection, analysis, and visualization.
- Improve productivity and quality, as it can produce infographics faster and more accurately than humans.
- Generate infographics that are suitable for different audiences, purposes, and contexts, based on the input, analysis, and design.
- Enable anyone to create infographics, regardless of their skills, knowledge, or experience.
Part B. How to Make Infographics with AI Tool?
One of the AI tools that can help you make infographics is EdrawMax, a powerful and versatile diagramming software that can create more than 280 types of diagrams, including infographics, flowcharts, mind maps, org charts, and more. EdrawMax has an AI feature that can generate infographics from text, data, or images, using natural language processing, computer vision, and machine learning techniques.
One of the advantages of using EdrawMax to make infographics with AI is that you can also use it to make videos from text, data, or images, using the same AI feature. This means that you can create dynamic and interactive infographics that can capture and retain the attention of your audience. You can also add voice-over, music, animation, and transition effects to your videos, to make them more engaging and appealing.
Key Features
- A large library of infographic templates and examples that cover various topics, such as business, education, health, environment, and more.
- A rich collection of infographic elements, such as charts, graphs, icons, images, maps, diagrams, timelines, and text, that you can drag and drop, resize, rotate, and edit as you like. You can also import your own elements, such as logos, photos, and fonts, to customize your infographic.
- AI feature that can generate infographics from text, data, or images, and can also generate videos.
- A user-friendly interface that is easy to use and navigate, with intuitive icons, menus, toolbars, and panels.
- Sync and share your infographics and videos across different devices and platforms, using cloud storage and online collaboration tools.
Pros
- Fast and easy to use.
- Powerful and versatile with a large library of templates, examples, and elements.
- Generate infographics and videos that are original, unique, and diverse, based on the input, analysis, and design.
- It is flexible and compatible.
Cons
- Requires a subscription fee to access all the features and functions of the software, such as the AI feature, the video feature, and the cloud storage.
- May generate infographics and videos that are not accurate, depending on the quality and quantity of the input, analysis, and design. You may need to edit and customize the infographics and videos to suit their needs and preferences.
How to Make Infographics with EdrawMax
Accessing EdrawMax:
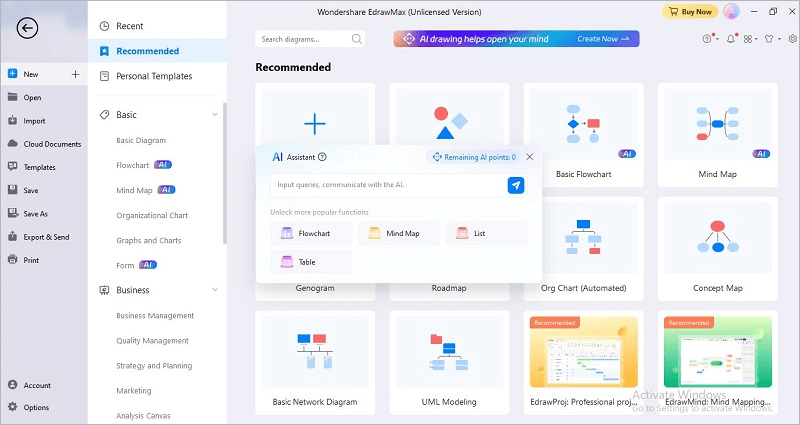
- Download EdrawMax and click on the "Create New" bar located above. The AI assistant will initiate.
Creating Infographics:
- Select a specific diagram type for your infographics creation. Alternatively, input your query directly into the search box.
- After choosing a diagram type, input your intended topic when prompted by AI. Click the "Go" icon to proceed.
Generating Ideas with AI:
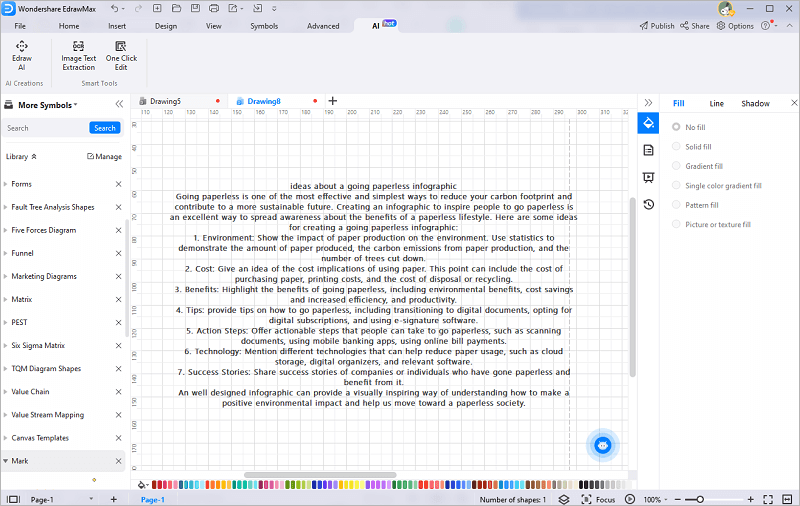
- Navigate to "AI" > "Edraw AI" > "Q&A" to input your query for generating ideas. For instance, type "Ideas about going paperless infographics."
- Edraw AI will promptly generate relevant ideas.
Developing a List:
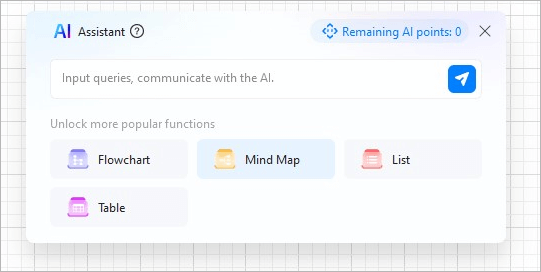
- Access the "Edraw AI" > "List" options, input your intended topic, and click "Go" to generate a list of ideas related to your topic.
Crafting Mind Map Infographics:
- Access the "Edraw AI" tab and choose "Mind Map" option. Specify the type of mind map infographics you desire, and Edraw AI will create a visually captivating mind map.
Designing Flowcharts:
- Access the "Edraw AI" > "Flowchart" tabs to create infographics flowcharts.
- Input your intended topic in keyword form and click "Go".
One-Click Editing:
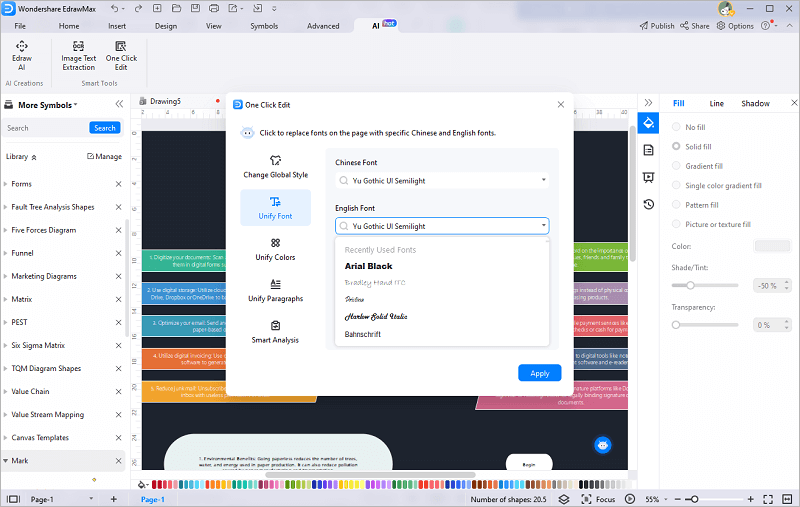
- Choose the "One Click Edit" option to adjust your diagram. Select "Change Global Style" from the editing dialogue box options.
- Apply your preferred theme and click "Apply".
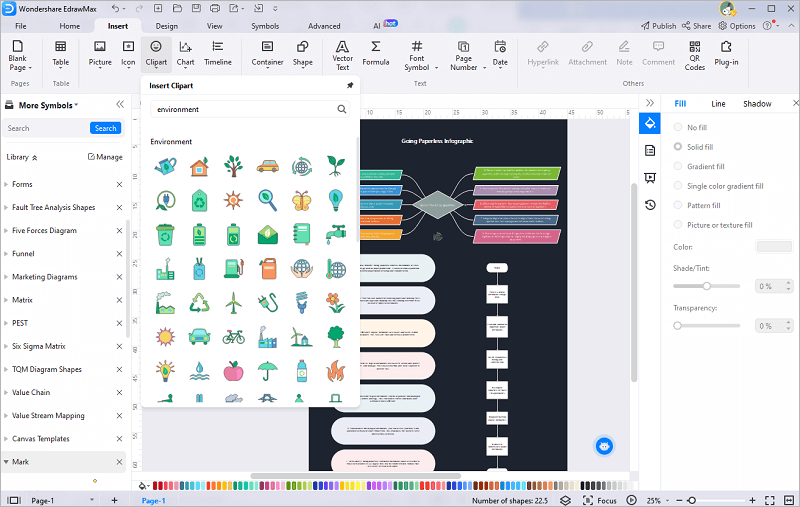
Adding Clipart:
- Access "Insert" > "Clipart" options.
- Find relevant clipart and add it to your diagram. Customize and rescale as needed.
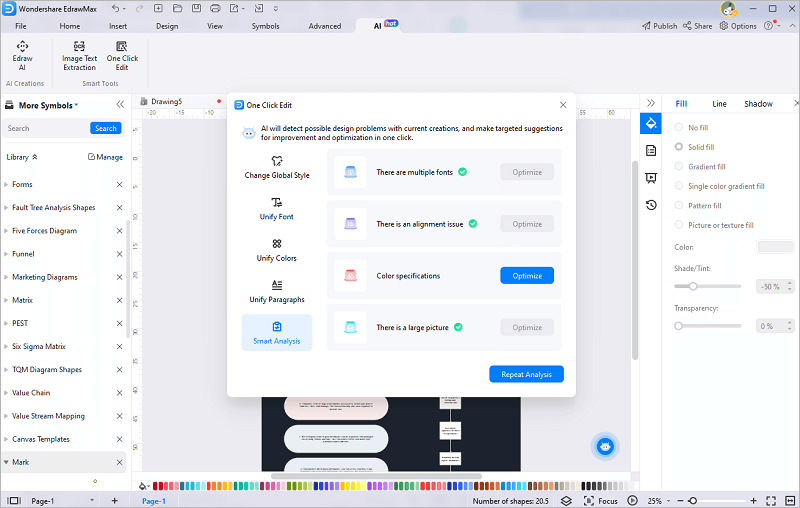
Smart Analysis:
- To conduct a smart analysis of your AI infographic diagram, navigate to "AI" > "One Click Edit" > "Smart Analysis".
- Enhance your diagram by clicking "Optimize" and accepting AI suggestions.
Conclusion
AI infographics can help people understand complex topics, communicate messages, or tell stories, by presenting information in a clear, concise, and engaging way. AI infographics can also save time and effort, enhance creativity and innovation, and increase accessibility and inclusivity, by automating and simplifying the process of creating infographics.
One of the AI tools that can help you make infographics is EdrawMax, a powerful and versatile diagramming software that can create more than 280 types of diagrams, including infographics, flowcharts, mind maps, org charts, and more. Give it a try!


